What’s in a name? John Stuart Mill, the noted 19th century thinker, once suggested that economics studies not humans, but “Economic Man.” Today that same idea is expressed in the term Homo economicus, the alien cousin of Homo sapiens, who is narrowly driven by self-interest and guided by unlimited rationality.
This article was featured in the Fall 2011 Issue of the CER Journal. Benjamin Chan is a contributor from Princeton University.
In today’s knowledge-based economy, the patent has a central role. As a form of intellectual property, it grants its inventor “the right to exclude others from making, using, offering for sale, or selling the invention” (35 USC § 154, ) and traditionally has been a central legal tool in the enforcement of property lights. In recent years, however, patents have not been treated solely as legal rights; instead they have gained popularity as financial assets. As early as 2005 it was estimated that patents and other intangibles such as trade secrets, copyrights, and trademarks contributed up to 75 percent of the value of publicly traded American companies, a significant jump from decades past (“A Market for Ideas”. 2005). In light of this newfound importance, a patent market has emerged in which patents can be disconnected from their inventor and assigned to another owner. There has been a stunning increase in the number of patent transactions over the past three decades.
The growth of this market has outpaced improvements in the valuation of patents, a crucial part of the patent transactions process. Studies have considered the possibility of predicting patent value through patent indicators, such as citations and claims, and research over the past two decades has shown some of these to be significantly correlated with value. Given that the indicators needed to estimate the value of a patent are public and easily accessible, this valuation approach has clear advantages over the traditional methods, requiring less time and incurring minimal costs (Omland 2011). However, these relationships have not been clearly quantified, due to the lack of publicly available patent price data. Instead, the majority of findings have been based in theory, as research has resorted to indirect measures, such as a firm’s market value, responses from inventors’ surveys, and patent renewal data to estimate patent value (Munari and Oriani 2011).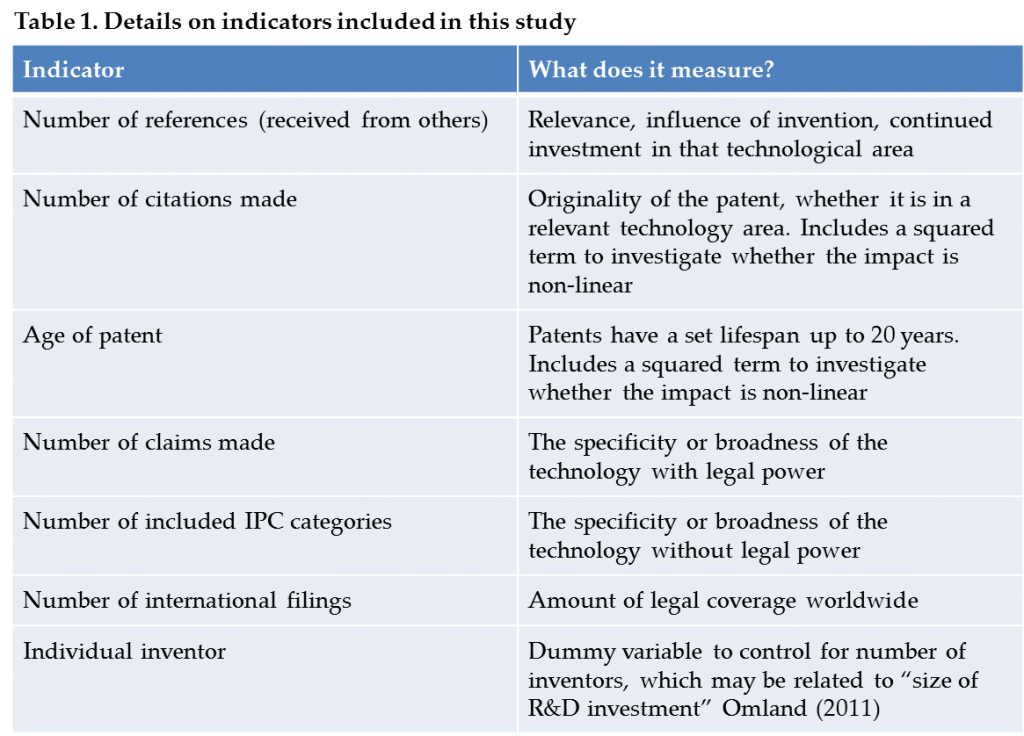
The following studies provide a good foundation, but their results as a whole are not cohesive, even though all three studies use the same dataset. Sneed and Johnson (2009) establish technological scope, international filings, references, backward citations, claims, age, owner, and lot size for sale to be statistically significant predictors of price, but Odasso and Ughetto (2010) find only the lot size for sale, forward citations, and age to be statistically significant. Furthermore, Nair et al. (2011) show only forward citations, age, and international filings to be significantly correlated with price. Perhaps most alarming, their research does not agree on the direction of the relationships, as one study finds international filings to be inversely correlated to price, while the others suggest a positive correlation. One reason for this inconsistency may be the differing choices of instruments the studies use to account for the sample selection problem caused by a form of omitted variable bias. In this specific case, a valid instrument would be correlated with the probability of sale but have no influence on the price of the patent. It seems that no such instrument has been credibly established. This is a troubling result, as it is known that using an invalid instrument may exacerbate the bias and inconsistency of the estimates (Achen 1986).
In contrast, this study establishes an alternative model for valuation, the censored regression model, which does not require instrumentation and will provide more precise estimates of the coefficients on each indicator.
Data
This study used the latest version of the Ocean Tomo dataset of U.S. patents, which details patents offered for sale in live auctions from 2006 to 2009. Each patent corresponds to a unique identification number, which I use to combine patent prices and indicators. From this dataset I select my measures of patent value to be the price of the patent (price) and the seller’s reserve value (open). Of the 1,628 patents I was able to acquire complete data for, 515 were sold and therefore had observations for their price. For the remaining unsold patents, the seller’s reserve value was available. Both price and open are right skewed, and there are a wide range of dollar values, so in the following analysis, I work with the logarithms of variables measured in dollar values. The patents offered for sale in the Ocean Tomo auctions seem to provide a relatively good representation of patents as a whole; they were diverse in technology and numerous in all nine auctions.
As for my indicators, I select the same indicators used by the previous authors, provided two criteria. First, the data must be easily accessible on the US Patent and Trademark Office (USPTO) website. Variations of indicators have been examined in theory, but I restrict my analysis to only those that are not derived from the bibliographic indicators.Second, the indicators must be pertinent to the patent value. That is, in considering that patents are most often traded to break market barriers to entry or to guard against lawsuits, the indicators should reflect some measure of the specificity and relevance of the coverage technology or the legal coverage of the patent.
From the USPTO I found data on the number of references (the citations received: ref), the number of citations (the citations made: cit), the number of claims (claims), the number of included International Patent Classification (IPC) categories (scope), the number of foreign patent documents (inter), and whether the patent was invented by an individual or not (individ). The majority of these patent indicators were previously quantified in the National Bureau of Economic Research’s (NBER) U.S. Patent Citations Data File (Hall et al. 2001), which has been updated up to 2006. Because some patents in the Ocean Tomo dataset were granted following 2006, the missing data for several patents were found on the USPTO website. I construct a final term inspired by the previous studies, the age of the patent (age), by subtracting the application date from the sale date. I chose not to construct age based on the grant date because a patent’s 20-year lifespan begins upon application, and there is often a lag period between the application and grant date. Summary statistics are included as Table 3. The following table describes what the specific indicators represent, based on theory.
I also decided that I would augment my regressions with the following control variables: the number of patents within the lot (lotsize), technology class (techclass) and an auction tag corresponding to the auction at which the patent was offered for sale (auction). Although Odasso and Ughetto (2010) were the first to use measures for year and technology type, they do so only as instruments in the selection stage of their model. I chose to include those in the valuation stage because it seems likely that the state of the market over time and whether or not the patent is in an industry requiring patent protection would influence price. For the technology classification, I used the NBER’s classification system, which categorizes the technologies into six main groups: Chemical (excluding Drugs), Computers and Communications, Drugs and Medical, Electrical and Electronics, Mechanical, and Others.
Methodology
At first glance, the Ocean Tomo dataset seemed quite large, but a closer look revealed a possibly confounding issue: the 1,628 patents were offered in 634 lots, so not all patents were offered singularly; in fact, only 377 lots correspond to the offering of a singular patent. As a result, the specific price for most patents is uncertain, since the price of a lot corresponds to the combined value of all the patents within a lot. Previous studies that have used the Ocean Tomo dataset have considered two methods to deal with this concern. Sneed and Johnson (2009) and Odasso and Ughetto (2010) study the patent indicators at the lot level, taking the average of all indicators, while Nair et al. (2011) restrict their analysis to only those patents sold singularly. In order to understand the differences between the results found from the models without introducing other variables, I test both of these two approaches of lot-level averaging and restricting to only singular patents.
While the previous papers have treated the Ocean Tomo dataset as having a sample selection bias problem resulting from unobservable patent prices, I argue that the price data are not entirely unobserved but rather censored. Ocean Tomo auctions were “conducted according to an ascending bid model, and a contract for the sale of the patent is formed by the highest bid made above the seller’s reserve and before the fall of the auctioneer’s hammer” (Odasso and Ughetto 2010). This means that if a patent was sold, the price must have been higher than the reserve, and if unsold, then the reserve was not met, suggesting that the price of the patent was lower than the reserve price. Mechanically, by combining these two variables into one variable and accounting for the observations that are censored, we have a left-censored dependent variable. This results in 515 uncensored observations and 1013 censored observations in this dataset. To account for the censored data, I use the Tobit model, which establishes a set upper or lower censoring points.
Having elucidated the estimation method, I now propose the following base model, which I estimate first with OLS and then with this censored model, subsequently adding in controls:
(1) logpricei = refi*β1 + agei*β2 + citi*β4 + claimsi*β5 + scopei*β6 + interi*β7 +
individi*β8 + controls*β + εi
where i indexes each individual patent or lot, β are the coefficients, and εi is the error term. The terms are explained in Table 1.
Hypotheses
In terms of the coefficients, I hypothesize that references will have a positive coefficient, as the previous studies have shown. An additional reference should suggest relevance, and thus interest in that specific patent. Age will have a negative correlation with price, given that the older a patent, the less time it has before expiration, and thus less time to generate value for the owner. I expect citations to have a positive coefficient, since a patent that cites many other patents is demonstrating its relevance. It is possible, however, that this measure is highly subjective, due to the fact that patent examiners often add new citations to an application. The relationship between technological scope and price seems less obvious. Because of the number of IPC categories in which a patent provides no legal power, I surmise there will no be strong correlation with price. Although a study has suggested otherwise, I expect claims and international filings to have substantial, positive coefficients, given that they represent the legal power of the patent. It is true that international filings require additional upkeep, but it seems reasonable to think that only patents that are worthwhile will be filed in other countries. It is hard to say how having an individual inventor affects price. Omland (2011) suggests that multiple inventors are linked with higher amounts of R&D investment, so I posit that individual inventor has a negative coefficient.
Results
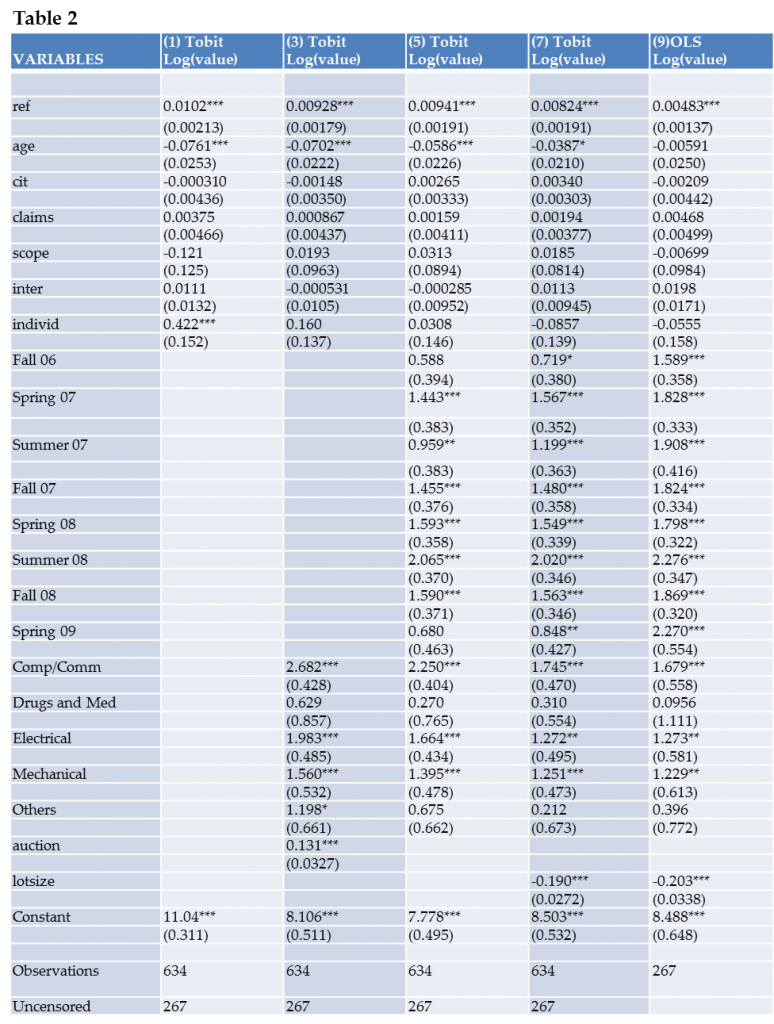
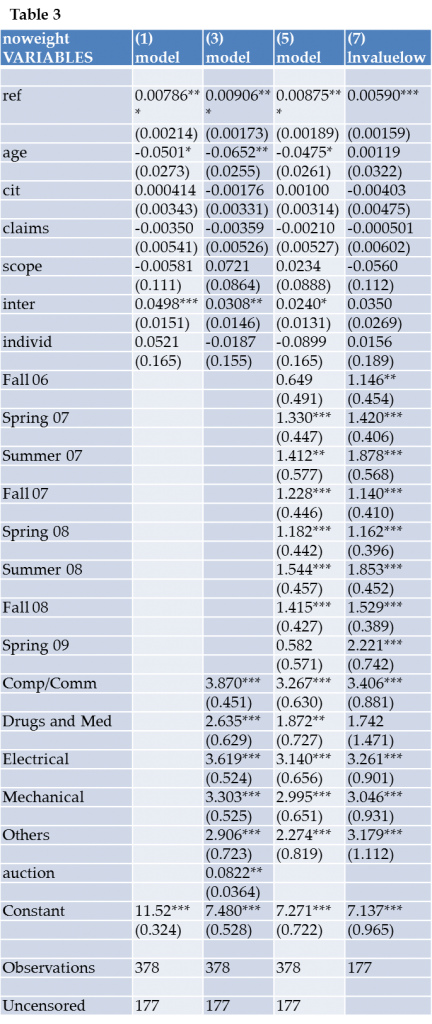
The results from the censored regressions are reported in Table 2 and 3. In both cases, I first estimate a base model of the indicators, before adding additional auction and technology class controls. In the lot-level averaged data, I was also able to include the term lotsize to estimate the impact of being sold in a group.
For the lot-level averaged data (Table 2), the base regression in column 1 shows that the number of references and having an individual inventor are positive, significant predictors of patent value. Surprisingly, having an individual inventor initially seems to represent a 42.2% increase in value over having an organization or group inventor. However, once the controls are added, all indicators except for references are insignificant (age was significant and negative, as predicted, but only at the 10% level). Additionally, the two terms representing legal power, claims and international filings are insignificant. The results of the singular patent regressions (Table 3) are very similar. The coefficient on references is significant at the 1 percent level, while the rest of the indicators are insignificant. The magnitude of the references coefficient matches that of the lot-level regressions (.008), suggesting that for each additional reference, a patent is worth 0.8 percent more in value.
Analysis of the controls yields more interesting results, as the auction, technology class, and lot size controls are strongly significant at the 1 percent level. The continuous auction term, as seen in column 2 of Table 2, has a coefficient of 0.131, representing a 13.1 percent increase in value per auction from Spring 2006 to Spring 2009. A closer look at this trend with the significant auction dummies, however, suggests that this trend was more nuanced. Fall 2006 is only significant at the 10 percent level, showing little difference in the price level from Spring 2006. Additionally, there are substantial, highly significant declines in Fall 2008 and Spring 2009 from the previous auctions. It is of note that in Spring 2009, only 21 patent lots were sold. This may explain the difference in the coefficient as estimated by the censored regression and the OLS regression, which is unable to take into consideration the seller’s reserve. As for the technology class, the results show that coefficients for Computers and Communications, Electronics, and Mechanical are positive and significant at the 1 percent level, while Drugs and Medical and Others were not. This suggests that patents in the classes of Computers and Communications, Electronics, and Mechanical were positively correlated with prices and worth more than the base dummy, Chemical. Again, the singular patent regressions show similar results. Lastly, the term lotsize is significant and negative, representing around a 20 percent decrease in price per additional patent within a group.
Previous literature claimed that several indicators are indeed good predictors of patent price, but the results of this study suggest a murkier picture, since all of the indicators except for references show insignificant coefficients. This study confirms the previous findings that references have a positive, significant correlation with patent price. This study finds a marginal effect of 0.8 percent, whereas the results of Sneed and Johnson (2009) show a less positive relationship, estimating it to be 0.2 percent. It also confirms that patents sold in groups seem to be of less value than those sold singularly because the term lotsize has a negative coefficient. While this study hoped to contribute to the understanding of the relationship between international filings and price, international filings is shown to be an insignificant indicator in this study. Although the base regressions in this study show that some indicators were significant, the controlled regressions indicate otherwise. Thus, based on this analysis, I conclude that these other indicators are not suitable predictors of price.
There are several reasons why the results of this study differ from previous literature, namely the use of the censored regression model as previously described. Additionally, previous researchers did not use the same control variables for their models, and this might explain the differences. From our regressions, however, the auction and technology class controls are valid and are significantly correlated with price. When added to the regressions, they account for significant jumps in the Wald chi-squared statistic of the maximum likelihood model, which is essentially the F-statistic used in OLS regressions; this suggests an improvement on the model.
Although the results are inconclusive with regards to the power of indicators to predict patent prices, this study improves the current understanding of the patent market, specifically through the control variables. From the time period of this analysis, 2006 to 2009, it seems the patent price level was increasing. The coefficient from the lot-level regression does not represent a year’s difference but only several months, suggesting that the growth was extremely rapid. One possible explanation for this would be that the patent market was gaining popularity. At the same time, the auction dummy variables showed that the Fall 2008 and Spring 2009 auctions resulted in much lower prices, canceling out much of the increase in patent price level. It is possible this decline was the result of the recent global financial crisis, which significantly worsened in late 2008 and early 2009. It seems that more than ever, patents indeed are treated as financial assets that are closely tied to the status of the current economy.
Additionally, the differing significance among the technology class dummies suggest that patents may play a bigger role in some industries than others. Patent transactions have not grown at the same pace in all industries. Based on the regression results, it seems that patent transactions play a big part in the high-tech industries but are not as important in the medical field. One explanation for this requires understanding the standard business model of each industry. While companies in computers and electronics often go through incremental improvements, thus generating a large number of patents, companies in biotechnology or pharmaceuticals have the majority of their value tied up with single novel drugs and treatments. If these types of companies were to trade their patents, their business could be significantly damaged.
Conclusion
Research on patent valuation through indicators suffers from the lack of publicly available pricing data. Although this paper is unable to make significant conclusions about the nature of the relationships between indicators and patent value, it still contributes a key insight: the use of a censored regression, which maximizes the information from the limited existing data. Even with the current confusion in this area of research, the growth in the patent transactions market makes continued study particularly intriguing.